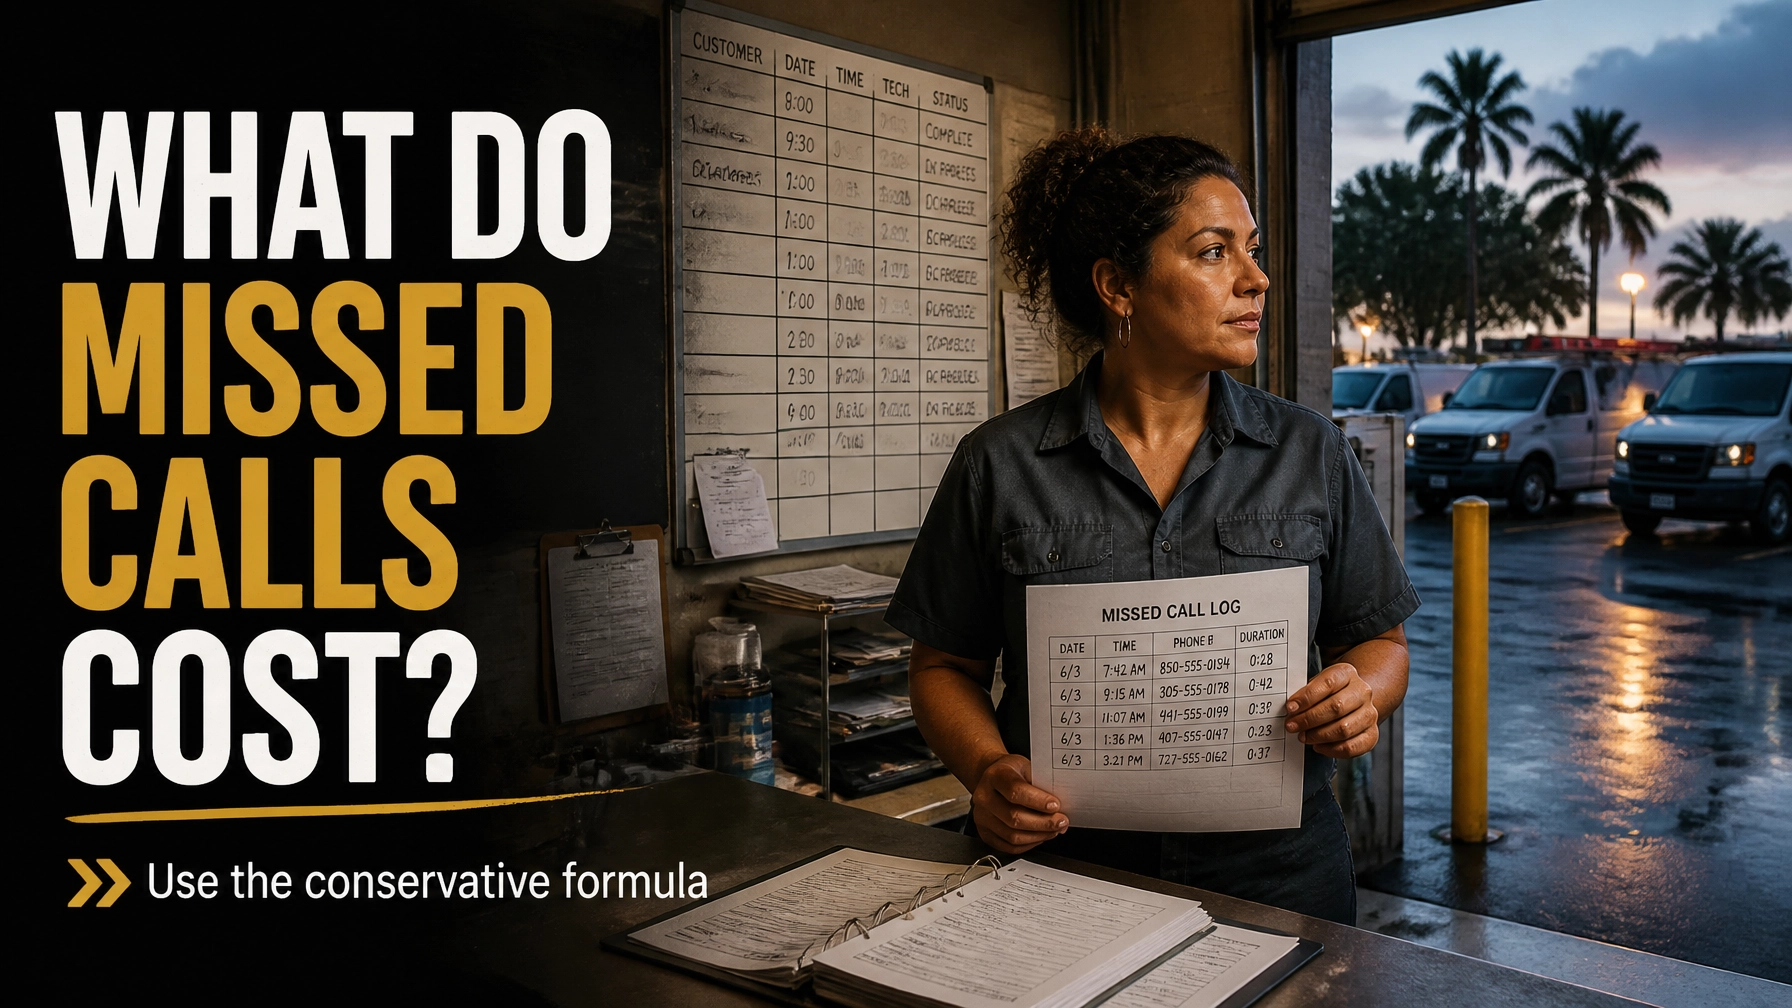
TL;DR: Most missed-call calculators are designed to sell answering services, so they often use aggressive assumptions. A more defensible formula is: Revenue at risk = missed after-hours calls per week × 4.3 weeks × share that were real opportunities × booking rate if answered × average job value. Use your own phone logs first. Exclude spam, robocalls, existing customers, and tire-kickers. Then apply conservative booking and recovery assumptions instead of assuming every missed call would have become a job.
Every missed-call calculator on the internet will give you a scary number.
That is the point.
Many are built by vendors selling answering services, AI receptionists, or call-management software. Their formulas may count every missed call as a lost customer, assume a high booking rate, and apply a large job value. The result looks impressive, but it may not survive five minutes of scrutiny against your actual phone log.
You need a calculation you can defend.
The stakes are real. A missed emergency plumbing call, no-cool HVAC call, electrical outage, or storm-damage roofing inquiry can go directly to a competitor. But not every unanswered call was a real opportunity.
The key is separating revenue at risk from revenue a vendor claims you lost.
The Conservative Missed-Call Cost Formula
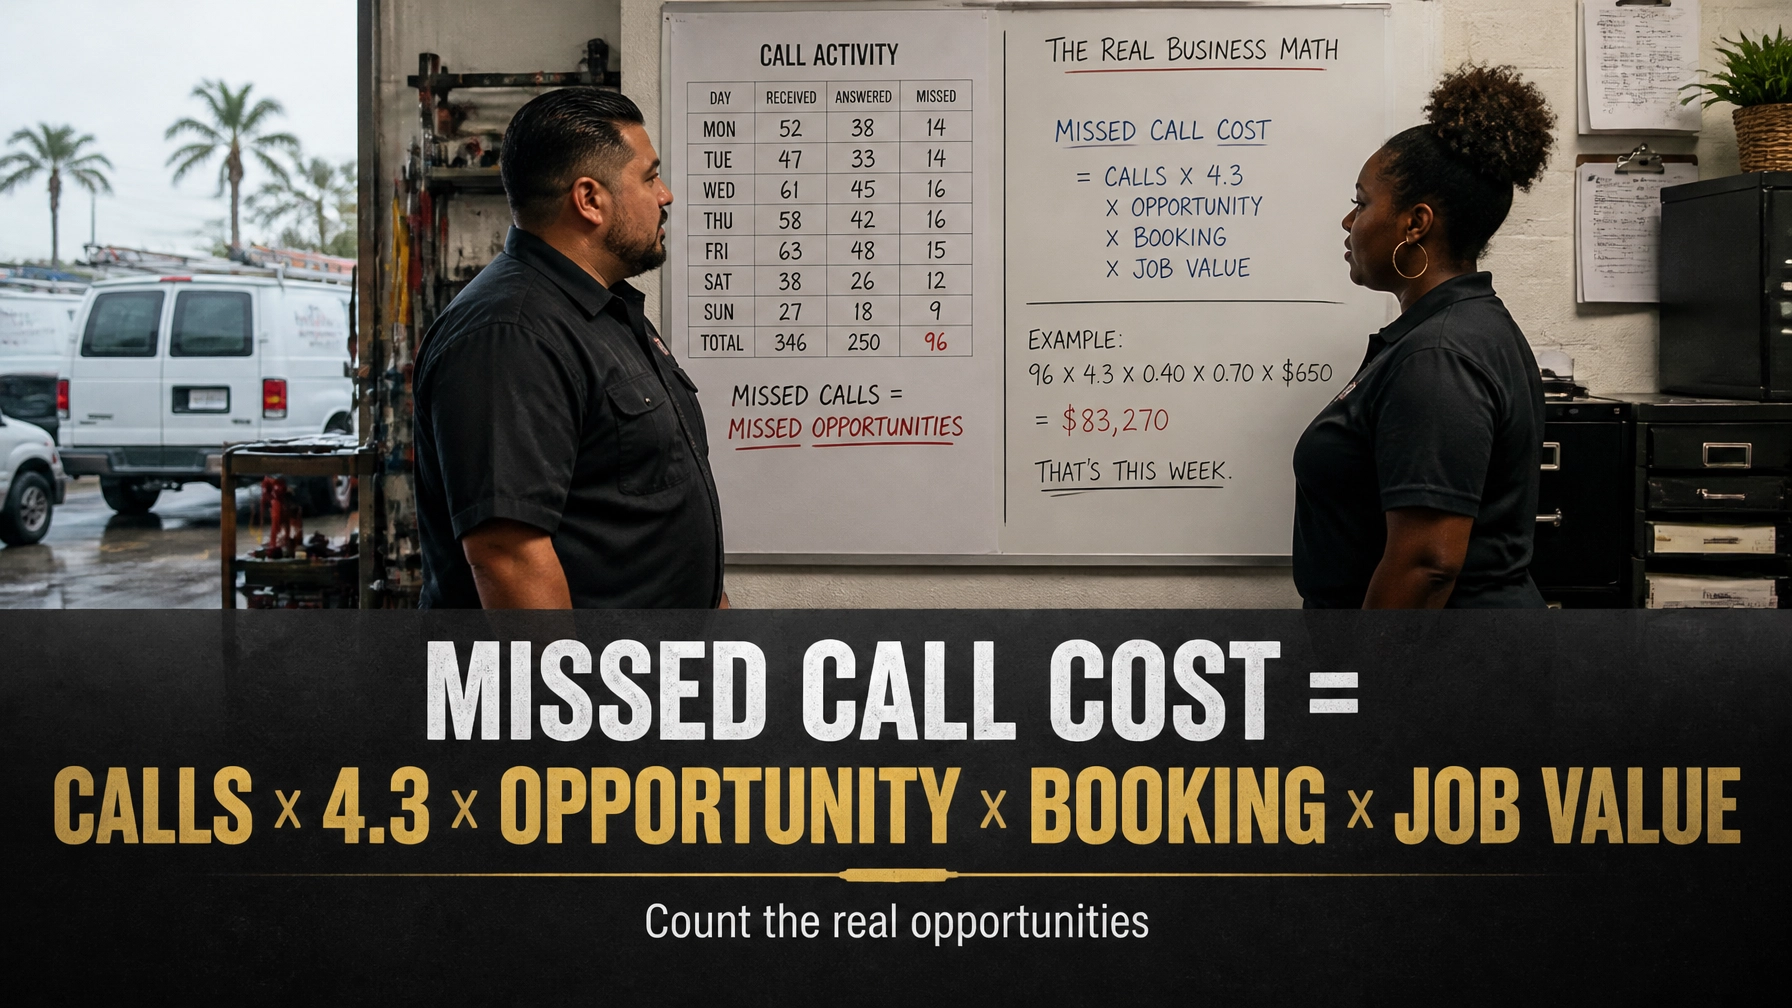
Use this formula:
Monthly revenue at risk = missed after-hours calls per week × 4.3 weeks × share that were real opportunities × booking rate if answered × average job value
Each input matters.
1. Count missed after-hours calls per week
Start with your phone system. Pull the last 30 to 90 days of inbound call records if you can.
Count calls that:
- Came in outside your normal answering hours
- Rang out or reached voicemail
- Were abandoned before anyone answered
- Came from a service-area number
- Lasted long enough to suggest a real person was calling
Do not start with an annualized vendor estimate. Start with your own data.
If your call volume changes sharply during Florida's summer HVAC season, hurricane recovery, heavy rain, or pest-control season, calculate separate monthly averages. A quiet January and a storm-heavy August should not be treated as the same operating environment.
2. Estimate the share that were real opportunities
This is the adjustment most inflated calculators skip.
Review a sample of missed calls and remove:
- Robocalls and spam
- Wrong numbers
- Sales solicitations
- Repeat calls from existing customers
- Calls outside your service area
- Calls asking for work you do not provide
- Price shoppers with no realistic buying intent
Then estimate the percentage that represented a legitimate, bookable opportunity.
For example, if you review 100 missed calls and determine that 60 were plausible new jobs, your real-opportunity share is 60%.
Do not assume 100%.
That one adjustment can cut an inflated estimate substantially while making the result more credible.
3. Apply your booking rate if answered
Your booking rate should reflect what happens when a qualified inbound call reaches a capable person, not what happens on your best day.
Published home-service benchmarks vary widely. Industry reports commonly place booking rates somewhere around 25% to 50% for answered calls, depending on trade, lead quality, staffing, scripting, pricing, and whether the business has a dedicated customer-service team.
The PCN missed-call revenue study summarizes booking and appointment-setting benchmarks across service businesses and shows why a conservative range is more useful than a single universal number.
Use your own data if available:
Booking rate = booked jobs from qualified inbound calls ÷ qualified inbound calls answered
If you do not have that number, use 25% to 35% for conservative planning. Move higher only when your call records support it.
4. Use your actual average job value
Pull revenue data from your field-service software, accounting system, or completed-job reports.
Calculate average job value using the same type of work you are measuring. A plumbing drain-clearing average should not be used to estimate HVAC replacement opportunities. Roofing, electrical panel work, water heaters, and emergency service calls may have very different ticket sizes.
Use collected or invoiced revenue, not the highest possible project value.
That keeps the estimate grounded.
Industry Benchmarks You Can Use as Starting Points
National and industry-reported benchmarks can help when your own data is incomplete. They are starting assumptions, not Florida-specific facts.
After-hours demand: roughly 30% to 50% as a planning range
Published estimates vary because "after hours" is defined differently. Some sources measure calls outside 8 a.m. to 5 p.m. Others measure bookable demand after the office closes.
For example, Convirza reports that 28% of bookable demand arrives after business hours. Other home-service analyses report higher percentages for HVAC and general contractor inquiries.
A practical planning range is 30% to 50% of inbound demand after hours, but treat that as a range to test against your phone logs, not a guaranteed industry average.
Answered-call booking rate: roughly 25% to 50%
A business with strong scripts, clear service areas, trained customer-service representatives, and available capacity may book well above 50% of qualified calls.
A busy owner answering between jobs may perform much lower.
For a first calculation, 25% to 35% is a defensible conservative range. Use 40% to 50% only when your historical data supports it.
First responder advantage: 78% is widely reported, but not a universal law
The often-repeated claim that 78% of customers buy from the first company to respond is generally attributed to LeadConnect or similar lead-response research. However, the original methodology is not clearly documented in publicly available materials.
You can treat the figure as an industry-reported directional benchmark, not as a guaranteed Florida trades statistic. A secondary review of the claim also notes the limited public documentation behind it.
The operational lesson still holds: a caller who reaches voicemail can call another contractor immediately.
Five-minute response advantage: use the 21x figure carefully
The widely cited claim that responding within five minutes makes a lead 21 times more likely to qualify than responding after 30 minutes is commonly attributed to the MIT and InsideSales.com Lead Response Management Study.
The exact multiplier depends on how the study defines connection, qualification, response window, and conversion. InsideSales' more recent 2021 lead-response research reports that conversion rates were eight times higher in the first five minutes across more than 55 million sales activities and 5.7 million inbound leads.
These are not Florida home-service studies.
Use them to support the importance of speed, not to promise a specific booking lift for your HVAC, plumbing, electrical, or roofing company.
Exec takeaway: Benchmarks can fill data gaps, but your phone log should control the final estimate.
Hypothetical Example: A Mid-Sized Florida HVAC Company
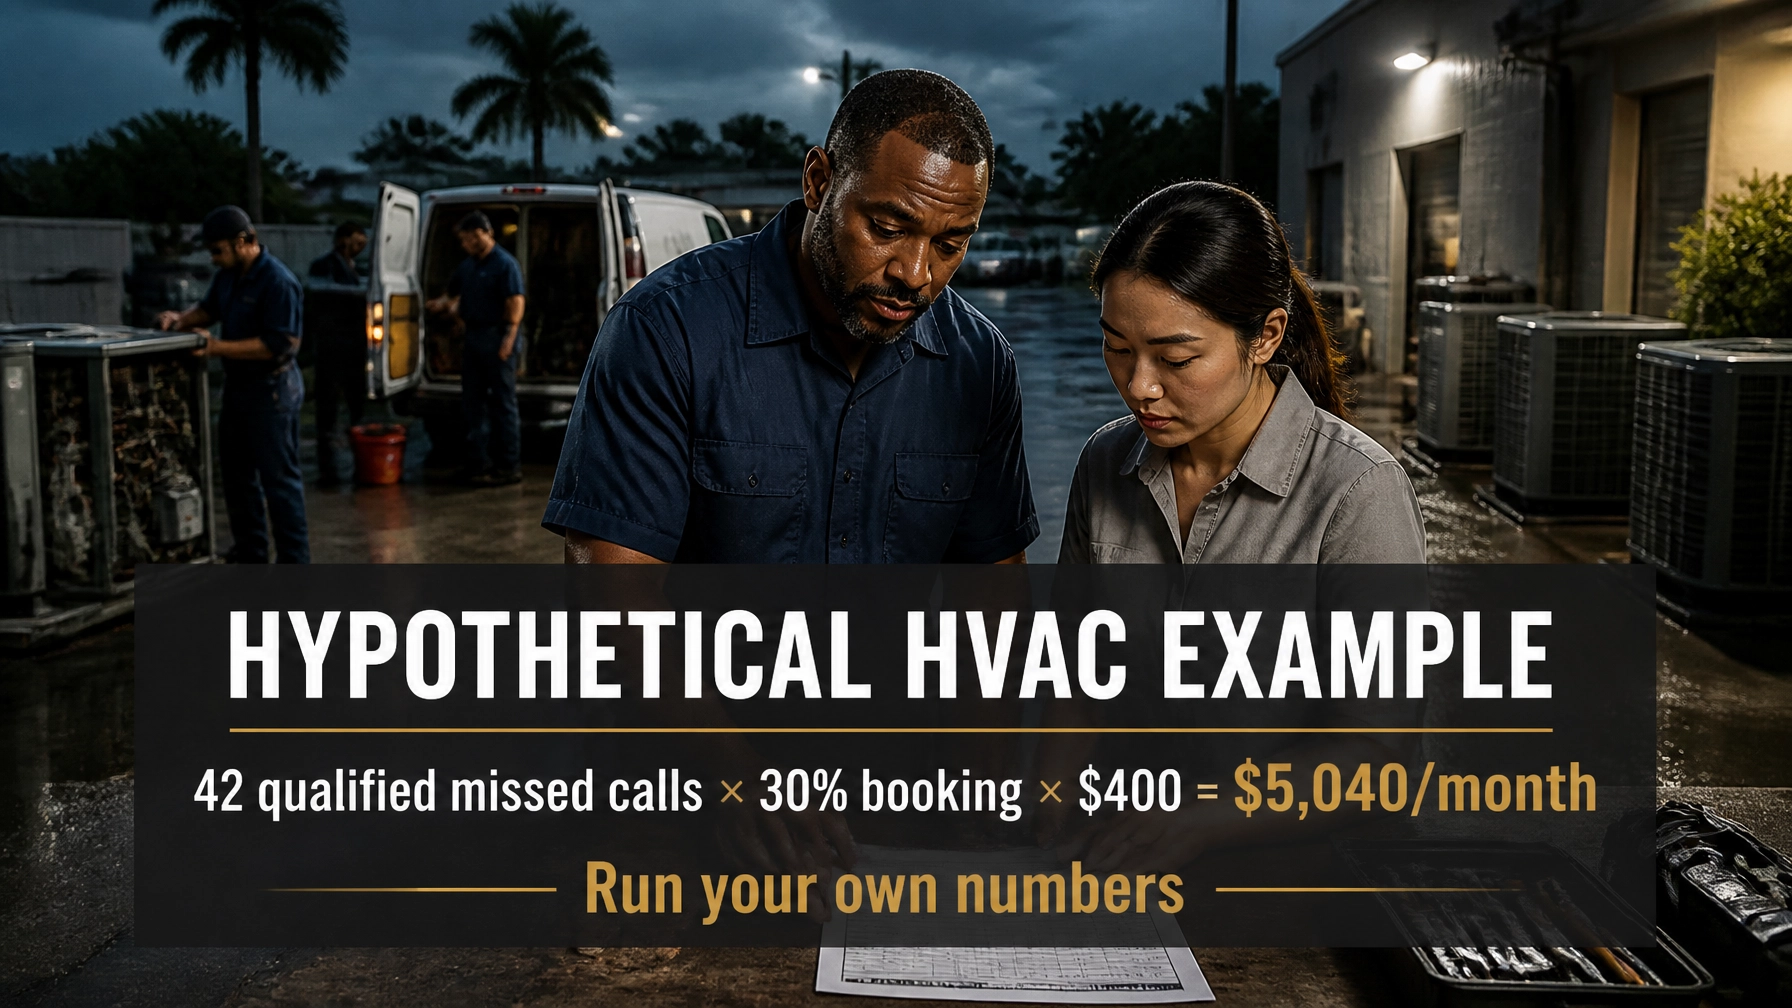
Consider a fictional HVAC company serving a mix of residential customers in Central Florida.
This is a hypothetical example. It is not a Bafmin client result.
The company reviews 90 days of call records and finds:
- 18 missed after-hours calls per week
- 65% appear to be legitimate new opportunities
- 35% is the booking rate for comparable answered calls
- $550 is the average job value for those opportunities
The calculation is:
18 × 4.3 × 0.65 × 0.35 × $550 = $9,687 per month in revenue at risk
Annualized:
$9,687 × 12 = $116,244 in annual revenue at risk
That number does not mean the company is guaranteed to recover $116,244.
It means the company may have approximately $9,687 per month in potential booked-job revenue passing through an unattended channel, based on its selected assumptions.
The result becomes more useful when management runs sensitivity scenarios:
| Scenario | Opportunity share | Booking rate | Average job value | Monthly revenue at risk |
|---|---|---|---|---|
| Conservative | 50% | 25% | $450 | $4,354 |
| Working estimate | 65% | 35% | $550 | $9,687 |
| Aggressive | 75% | 50% | $650 | $18,866 |
This range tells the owner more than one dramatic number.
It shows which assumptions deserve better measurement.
What You Can Actually Recover
AI answering and live answering services can recover a portion of missed-call revenue.
They cannot recover every dollar.
Some callers will already have hired another contractor. Some will be outside your service area. Some will not be ready to book. Some jobs will not fit your schedule or margins. A caller may also reject the price even after speaking with a person.
A realistic planning assumption may be that effective answering and follow-up convert 40% to 60% of missed qualified calls that could have converted if handled well.
That is a recovery assumption, not a guarantee.
Using the hypothetical HVAC company's working estimate:
- Monthly revenue at risk: $9,687
- 40% potential recovery: about $3,875
- 60% potential recovery: about $5,812
This is more credible than claiming 100% recovery.
The system still needs to answer accurately, qualify the customer, respect service areas, identify emergencies, book within real capacity, and escalate situations that require a human. A fast but inaccurate response can create dispatch problems, customer frustration, and margin damage.
Old Way vs. New Way
Old way
You count missed calls once a month, guess at the value, and choose the biggest number because a vendor says every caller was ready to buy.
New way
You audit the phone log, separate real opportunities from noise, use your own booking rate, model a range, and measure recovered jobs after implementation.
Old way
You track total call volume but not what happened after each call.
New way
You track:
- Answer rate
- After-hours call volume
- Qualified-call rate
- Booking rate
- Average job value
- Response time
- Recovery rate
- Cost per recovered job
- Revenue collected from recovered calls
This is the same operational logic behind Bafmin's AI workflow automation guidance for Florida trades. The goal is not to add another dashboard. The goal is to connect calls, qualification, scheduling, dispatch, follow-up, and revenue measurement.
For more context on the after-hours problem, read The $12,000 Night: What After-Hours Calls Cost Florida Trades. You can also browse Bafmin's trade-focused insights for plumbing, HVAC, electrical, roofing, and other service businesses.
The Bottom Line
Missed calls can cost your Florida trade business real revenue.
But the number should come from a disciplined calculation, not a vendor's most aggressive assumptions.
Use this formula:
Monthly revenue at risk = missed after-hours calls per week × 4.3 × real-opportunity share × booking rate if answered × average job value
Start with your own call records. Exclude junk. Use conservative rates. Model a range. Then measure what happens after you improve coverage.
Competitors are already adopting faster intake, automated follow-up, and 24/7 answering workflows. Waiting does not make the missed opportunities disappear.
This is also why Bafmin is running a real survey of Florida trade companies right now. National averages are inconsistent, and Florida HVAC, plumbing, electrical, roofing, landscaping, pest-control, and other trade businesses face different seasons, service areas, weather events, and customer behavior.
We are building Florida-specific benchmarks based on real trade-company data, not invented client results and not vendor hype.
Join the list through Bafmin's contact page to receive the Florida missed-call benchmark report when it publishes.
Frequently Asked Questions
How do I calculate the cost of missed calls?
Multiply missed after-hours calls per week by 4.3, then multiply by the share that were real opportunities, your booking rate if answered, and your average job value.
Should I count every missed call as lost revenue?
No. Exclude spam, robocalls, wrong numbers, existing-customer calls, out-of-area inquiries, and calls for services you do not provide.
What booking rate should I use?
Use your actual booking rate when possible. If you do not have reliable data, begin with a conservative 25% to 35% planning assumption and test a range.
Is 78% of customers hiring the first contractor who responds proven?
The 78% figure is widely reported by lead-response vendors, but its original methodology is not clearly documented publicly. Treat it as directional industry reporting, not a guaranteed home-service benchmark.
Can AI or live answering recover all missed-call revenue?
No. A capable answering and follow-up system may recover a meaningful fraction of qualified opportunities, but some callers will choose competitors, decline the work, fall outside your service area, or fail to book for other reasons.